Friday, May 11, 2012

Chapter 13: Measuring the Economy's Performance


Ch 13 measuring_the_economys_performance from jtoma84





II. Solving for CPI/Inflation Rate

Another way to put this is: (year 2 / year 1) * 100 = CPI

Therefore... if your total cost of basket in base year is $830 and the total cost of the year 2 basket was $1,015 your CPI would be 122.

HOW???

Well... 
1. (y2/y1)*100
2. (1,015/830)*100 = 122
3. CPI = 122

Next you need the inflation %...
The easy way to do it is to subtract 100 from the CPI, since 100 is the standard you always multiply with in order to calculate CPI.

So the inflation rate if a CPI is 122 is 22% (122-100)

Or the longer formula is:

Now for the tricky part... How would you figure out the Market Basket if you had multiple prices and quantities of goods?

You would need to understand the Measurement of Price Changes.

III. Measurement of Price Changes.
Let's say that in New Jersey, there are only 3 goods: popcorn, movie shows, and diet drinks. The following table shows the prices and quantities produced of these goods in 1980, 1990, and 1991:
1980
1990
page1image19064
1991
P
Q
P
Q
P
Q
Popcorn
1.00
500
1.00
600
1.05
590
Movie Shows
5.00
300
10.00
200
10.50
210
Diet Drinks
0.70
300
0.80
400
0.75
420

P = Price
Q = Quantity

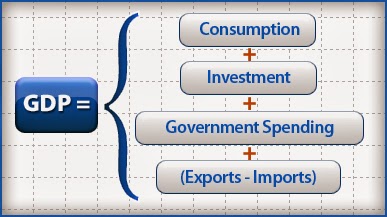
Note: The quantities (Q) in the table above are not used in answering the questions below. These would be used, however, to calculate both GDP and the GDP deflator. (The GDP deflator is the price index associated with GDP, where the bundle of goods under consideration is the aggregate output of the economy. It is used to convert between nominal and real GDP.)


a) A "market bundle" for a typical family is deemed to be 5 popcorn, 3 movie shows, and 3 diet drinks. Compute the consumer price index (CPI) for each of the three years, using 1980 as the base year.


      The consumer price index for 1980 is 100.  This is easily seen:
CPI80 =cost of buying the market bundle in 1980 / cost of buying the market bundle in 1980 * 100

Which would be:
(5×1.00)+(3×5.00)+(3×0.70)/(5×1.00)+(3×5.00)+(3×0.70) * 100
CPI = 100


The consumer price index for 1990 and 1991, respectively, is:


  1. CPI90  = cost of buying the market bundle in 1990 / cost of buying the market bundle in 1980 * 100 
    CPI90 = 169.2

  1. CPI91 =  cost of buying the market bundle in 1991/cost of buying the market bundle in 1980 * 100

  1. CPI91 - 176.5 


    b) What was the rate of inflation from 1990 to 1991, using the CPI you calculated in (a)?
    The rate of inflation equals the percentage change in the price index from 1990 to 1991. This is: 4.3% 


Chapter 9: Competition & Monopolies


Chapter 7: Demand & Supply


7.3 from jtoma84

7.4 from jtoma84


Supply and Demand


Law of Diminishing Marginal Utility + Example


Chapter 3: Your Role as a Consumer


Chapter 3 1 from jtoma84

II. College Loan Links:

http://www.loans.ucla.edu/pdfs/Managing_Your%20_Student_Loan.pdf - this is a great pdf introduction to what loans are and how to manage them

https://www.scholarships.com/financial-aid/calculators/college-cost-worksheet/ - features a college cost calculator 

Chapter 2: Economic Systems and the American Economy


Example of a Circular Flow Model:


I. Inflation
A. Definition: Inflation means that the general level of prices is going up, the opposite of deflation. More money will need to be paid for goods (like a loaf of bread) and services (like getting a haircut at the hairdresser's). Economists measure inflation regularly to know an economy's state. Inflation changes the ratio of money towards goods or services; more money is needed to get the same amount of a good or service, or the same amount of money will get a lower amount of a good or service.


B. Causes: When the total money in an economy (the money supply) increases too rapidly, the quality of the money (the currency value) often decreases. Economists generally think that this money supply increase (monetary inflation) causes the goods/services price increase (price inflation) over a longer period. They disagree on causes over a shorter period. NOTE: Later in the Semester (Chapter 7- we will examine shorter periods of time and potential reasons)

II. Deflation:

A. Definition: Deflation means that generally the prices of products are going down. It is the opposite of inflation. It is said, that deflation happens when there is less money than there are goods (goods are almost any kind of product). It is also said that deflation is a sign of a weak state of that country's economy, because deflation usually happens during an economic collapse. Deflation is thought to be even worse than inflation.

B. Potential Causes: Deflation starts when people are waiting for prices to go down even more. They will then spend less money. Because of that, companies can not afford to keep up the amount of goods that are made, and have to lower that amount, as well as fire workers to make even a small profit.


**The Importance of Equity
Equity's value in regards to economic choice and systems is substantial. It directs the choices businesses make about how their resources are used.

**The importance of Free Enterprise
Free Enterprise allows for competition. Competition in the market is ideal because it allows for products to increase in quality and a more affordable price for the benefit of the consumer.

INTRODUCTION/ Chapter 1: What is Economics

Well, it's the end of the road... so to provide you with the best possible review for your exam: here are all the PowerPoints complete with typos

P.S.- here is the freakonomics url: https://youthentrepreneurs.org/content/upload/files/freakonomics.pdf
I. Production Possibility Curve Explanation:

What can cause things to not be able to operate outside of the curve? Well an example could be technology that is not feasible. Or maybe what is necessary to have a point outside of the curve, for instance more capital [whether it is money or resources] is not attainable currently.

II.- Curve Shifts to the Right
Now- remember: If we introduce more capital/resources or any additional Factors of Production, it is possibile to shift the curve to the right! Like so: [look below]
Let's look at an example of how our curve can shift to the right:

III. Points INSIDE of the Curve: Now what happens if we plot something INSIDE of the Curve? Well this…
This plot point shows that we haven't lost any Factors of Production, we just are not using those resources efficiently. We will examine reasons as to why this occurs later on in the Semester… specifically when we discuss the Law of Diminishing Returns.

IV. Curve Shifts INWARD:
If the curve shifts inwards, well that means we are losing some sort of Factor of Production and then it will look like this: